Examples
There are several examples available that cover different setups. These examples are a good starting point to get to know Testbeam Analysis.
ATLAS FE-I4 telescope
The FE-I4 telescope data example shows how to run a full analysis on data taken with a FE-I4 telescope.
Note
Only prealignment is done here, since the telescope data is too coarse to profit from an aligment step. The data was recorded at DESY with pyBar. The telescope consists of 6 DUTs with ~ 2 cm distance between the planes. Only the first two and last two planes were taken here. The first and last plane were IBL n-in-n planar sensors and the 2 devices in the center 3D CNM/FBK sensors.
The created plots after the consecutive analysis steps are shown here:
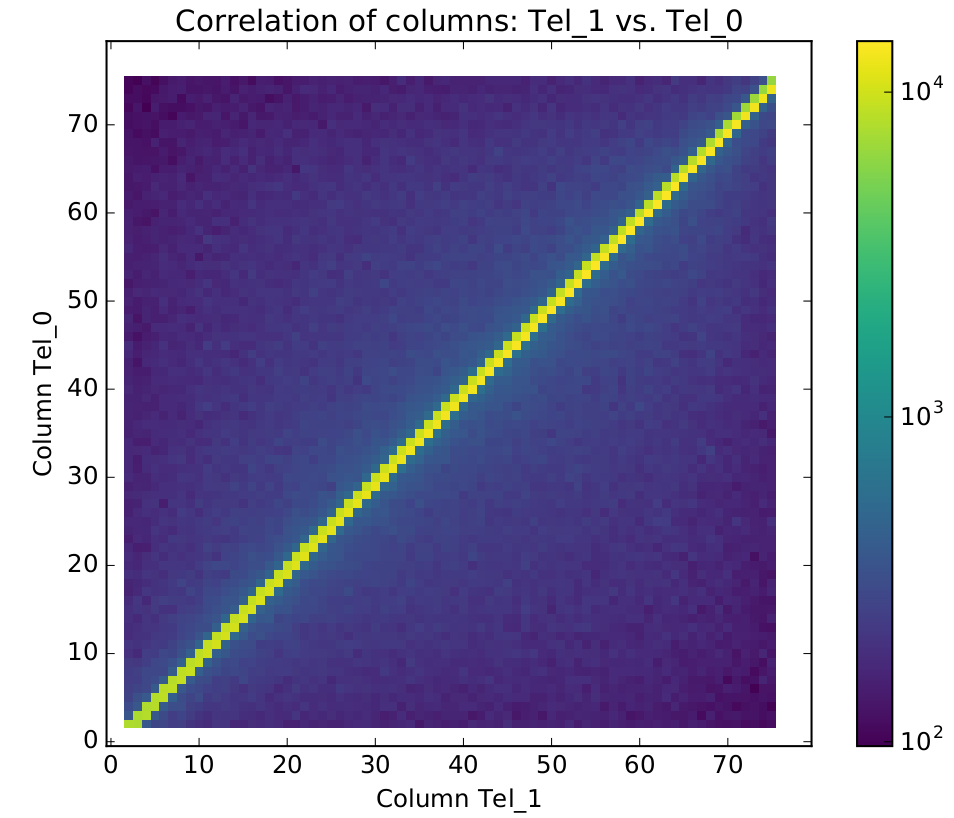
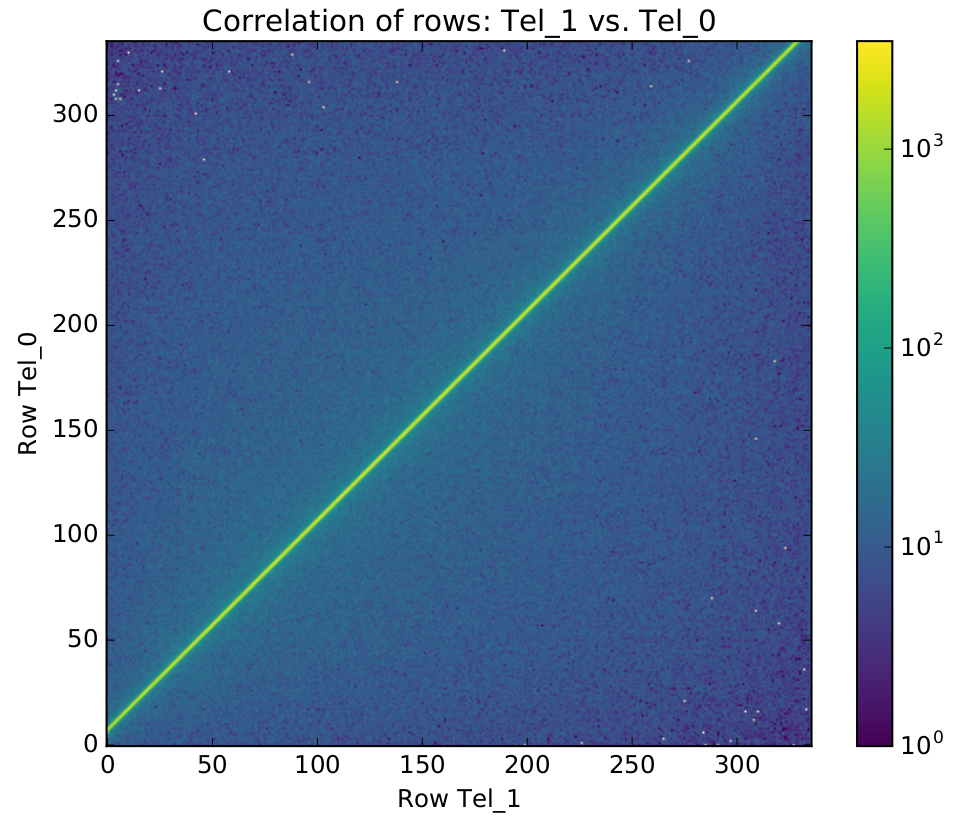
Original correlation pdf output
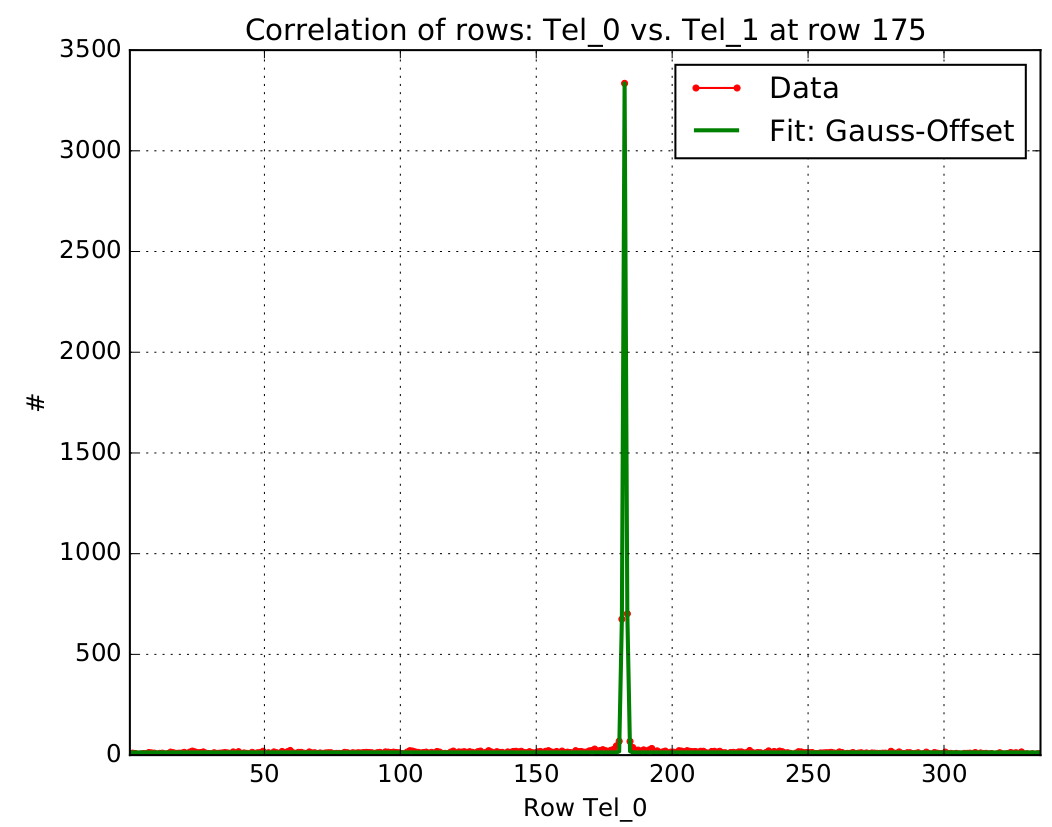
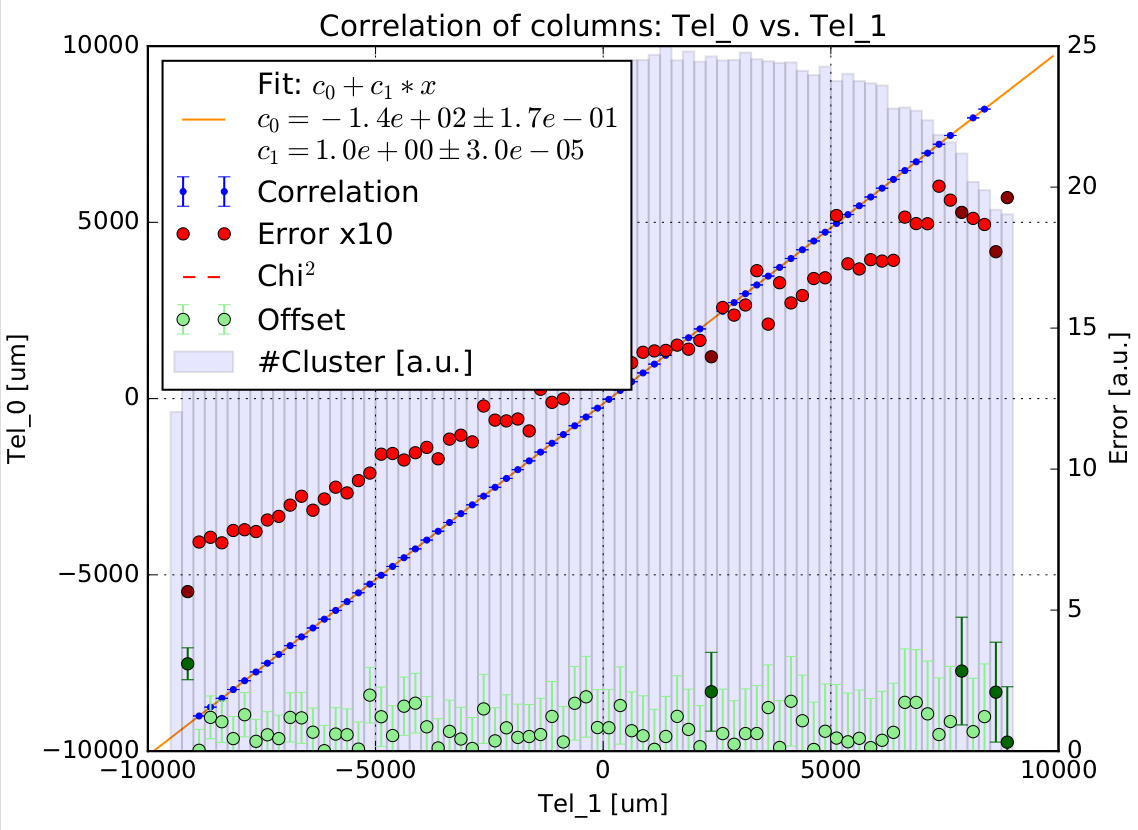
Original pre-alignment pdf output
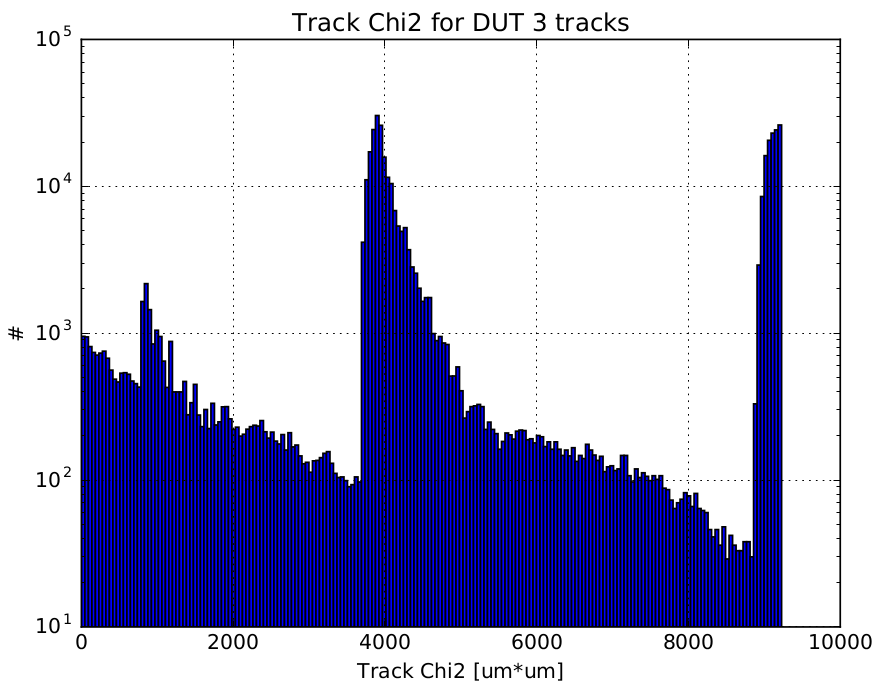
Original track fitting pdf output
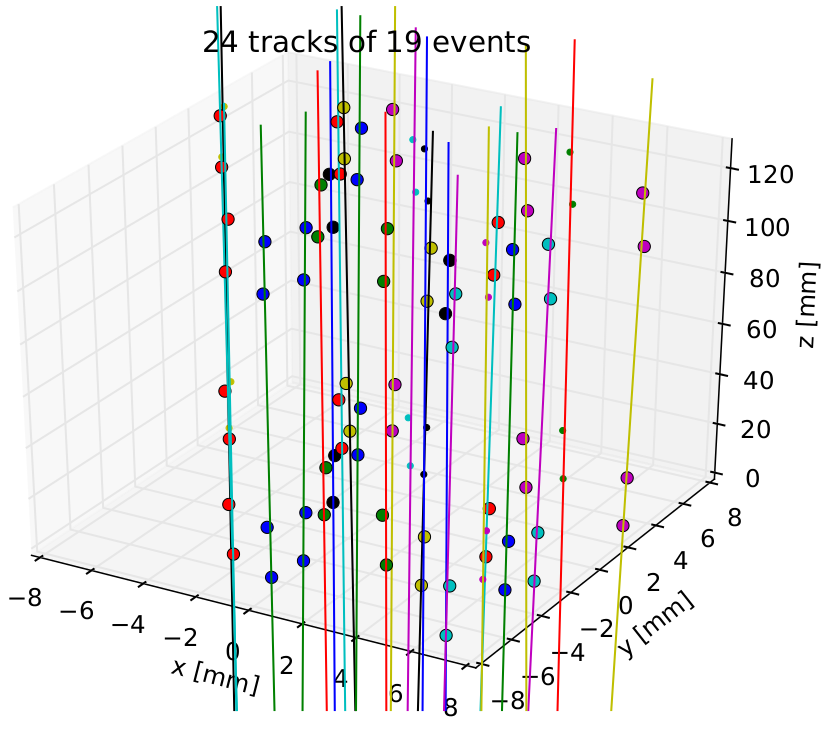
Original event plot pdf output
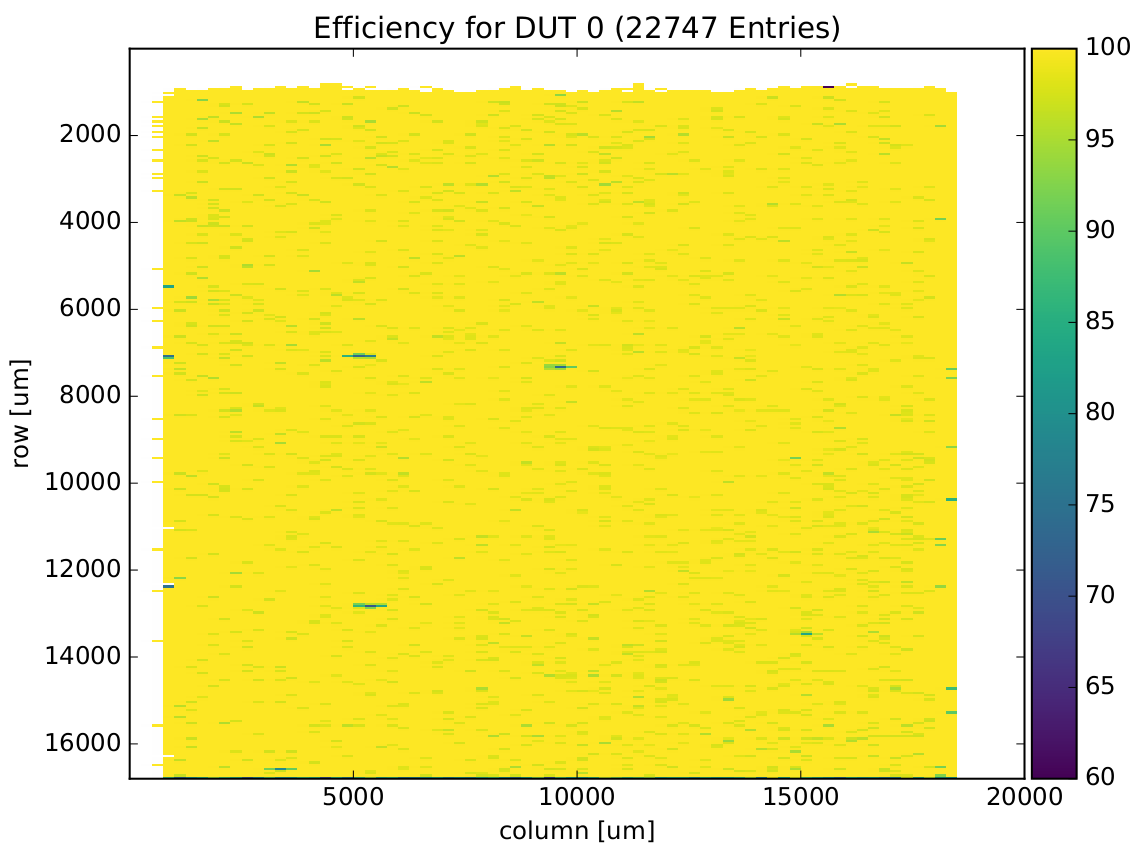
Original efficiency pdf output
EU telescope
Example script to run a full analysis on telescope data. The original data can be found in the example folder of the EUTelescope framework.
Data in https://github.com/eutelescope/eutelescope/tree/v1.0-tag/jobsub/examples/datura-150mm-DAF
The residuals are calculated with different cuts on prealigned and aligned data for demonstration purpose:
- When only prealigning the DUTs and using all DUT hits and cutting on the chi2: The residuals are very dependent if the prealignment is sufficient. Residuals are usually rather high (several 10 um)
- When aligning the DUTs and only interpolating the tracks from 2 DUTs: The residual for the planes 2 - 4 (DUT 1 - DUT 3) are about 6.5 um in x/y and comparable to the residuals from the EuTelescope software (6 um).
- When aligning the DUTs and using all DUT hits and cutting on the chi2: The residuals and selected number of tracks are highly dependent on the chi2 cut and are at least 6 um and usually < 10 um depending on the plane position. This is an effect of multiple scattering. The outer most plans have a rather high residual (~ 18 um)
- When using a Kalman Filter for track builing instead of an interpolation which takes no correlations between the measurements into account, the residuals can be improved by ~ 30 percent for the inner planes.
Setup
The telescope consists of 6 planes with 15 cm clearance between the planes. The data was taken at Desy with ~ 5 GeV/c (Run number 36).
The Mimosa26 has an active area of 21.2mm x 10.6mm and the pixel matrix consists of 1152 columns and 576 rows (18.4um x 18.4um pixel size). The total size of the chip is 21.5mm x 13.7mm x 0.036mm (radiation length 9.3660734)
The matrix is divided into 4 areas. For each area the threshold can be set up individually. The quartes are from column 0-287, 288-575, 576-863 and 864-1151.
The Mimosa26 detects ionizing particle with a density of up to 10^6 hits / cm^2 / s. The hit rate for a beam telescope is ~5 hits / frame.